Published 5 seconds ago
Over the past three weeks, the largest cryptocurrency-Bitcoin has remained sideways and traded strictly between $31450 and $29600 levels. While a consolidation after a bullish rally is considered preparation for the next leap, the sideways action has prolonged enough to consider the market sentiment is uncertain. Thus considering the aforementioned zone as a no-trading area, the potential target must wait for a breakout.
Also Read: Bitcoin (BTC) Set For $35000, Ethereum (ETH) Above $2000 As US CPI Inflation Falls
Bitcoin Price Daily Chart
- The rejection candle near $31450 indicates the sellers continue to defend this resistance
- The potential buyers can look at the entry for $31200 or a retest to the rising trendline.
- The intraday trading volume in Bitcoin is $14.5 Billion, indicating a 7.5% loss.
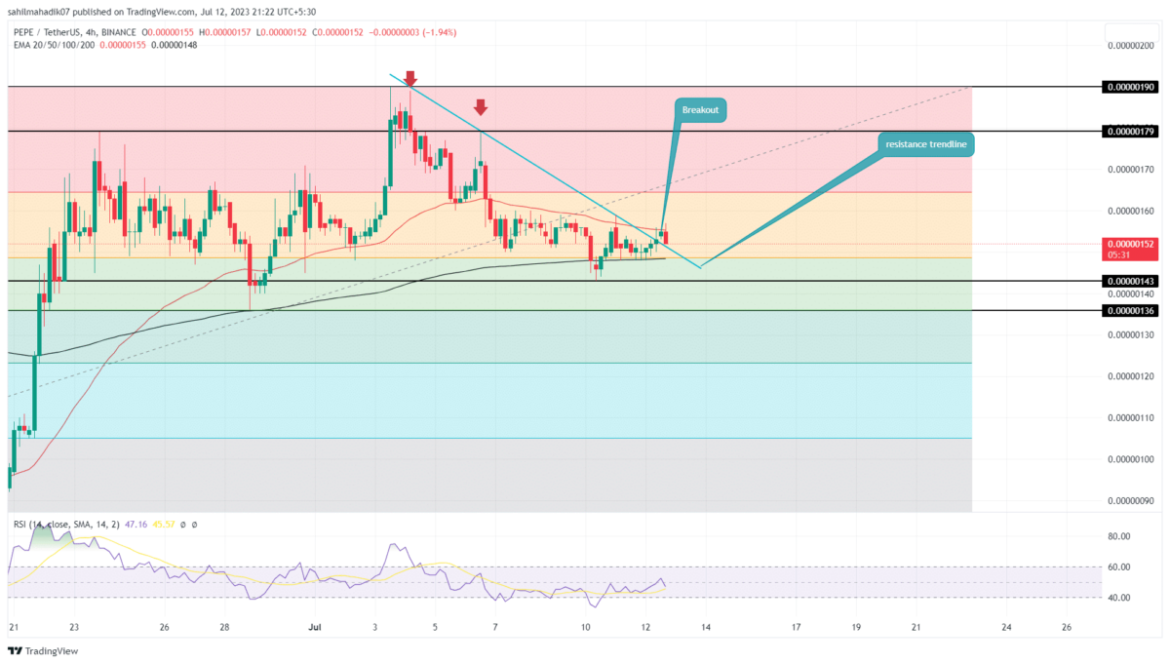
 Source-Tradingview
By the press time, the Bitcoin price trades at $30629 and with an intraday loss of 0.2% projects another reversal from the range resistance. A high wick rejection attached to the daily indicates the overhead supply pressure is intact, the ongoing consolidation phase could prolong.
The potential reversal could plunge the BTC price by 3.3% to revisit the $29600 support. Thus, a decisive breakout from the range barriers is crucial to determine the upcoming price trend.
A breakdown below the $29600 support may trigger a longer correction in Bitcoin price and retest $27500 aligned with the rising support trendline. The coin holders can use this trendline as a trailing stop loss to ride this recovery rally longer.
What if Bitcoin Breaks the $31450 Barrier?
A bullish breakout from the $31450 resistance with daily candle closing will release the trapped bullish momentum and set Bitcoin price for further rally. The newly reclaimed support could offer a solid launchpad and drive a rally 10% higher to hit $34500.
The presented content may include the personal opinion of the author and is subject to market condition. Do your market research before investing in cryptocurrencies. The author or the publication does not hold any responsibility for your personal financial loss.


