Published 21 mins ago
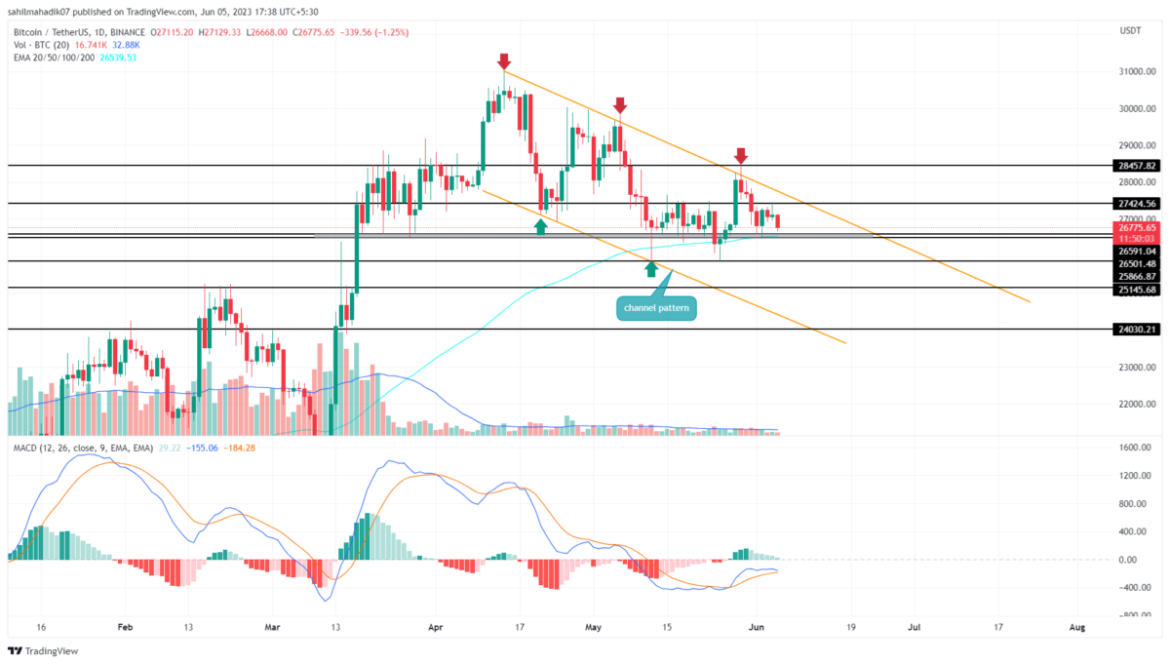
Bitcoin Price Analysis: The Bitcoin price witnessed a bearish reversal from the resistance trendline of the channel pattern on May 29th, indicating the buyers are not yet ready to start a recovery rally. From the reversal point, the BTC price plunged 5% over the week and currently exchange hands at $26749. The ongoing downfall may soon challenge another support level of $26500, which will validate if coin holders are going to lose more ground.
Also Read: Bitcoin (BTC) Accumulation Zone Identified, What’s Next for Price Growth?
Bitcoin Price Daily Chart
- Bitcoin Fear & Greed Index at 53% reflects a neutral sentiment in the market
- A breakdown below $26500 support will set the BTC price for a 5% drop
- The intraday trading volume in Bitcoin is $12.2 Billion, indicating a 40% gain.
 Source-Tradingview
A bearish reversal from the pattern’s resistance trendline has set the Bitcoin price for a bear cycle within the channel pattern. Ideally, this potential downfall could plunge the price back to the lower trendline which for BTC is around $24000.
As of now, the falling prices are approaching another significant support of $26600-$26500 in an attempt to breach below it. A successful flip of this support and resistance will provide sellers a solid barrier to pressurize the coin price lower.
With sustained selling, the Bitcoin price may plunge another 5% to hit $25000, followed by $24000.
Will Bitcoin Price Reclaim $27500 In June?
For Bitcoin price to expect a sustained recovery, it needs to breach the overhead trendline of the channel pattern. The potential breakout will be an early sign of trend reversal which could replenish the prior recovery rally. The first target of completing the pattern would be $28500.
- Moving Average Convergence Divergence: A bearish crossover between the MACD(blue) and signal(orange) line in the weekly chart signal additional confirmation for downtrend resumption.
- Exponential Moving Average: The 100-day EMA slope wavering near $26500 accentuates the importance of this level on ETH price.
The presented content may include the personal opinion of the author and is subject to market condition. Do your market research before investing in cryptocurrencies. The author or the publication does not hold any responsibility for your personal financial loss.


