Ethereum traders have been contemplating their next steps as the second-largest crypto slid below $1,600 and revisited support at $1,564. While a kneejerk reaction is anticipated, it is not guaranteed, considering the state of the crypto market – low volatility.
The hype to buy the dip with the possibility of a relief rally has faded since June. Investors prefer to watch from the sidelines afraid of capitulation at least until the crypto market generally improves.
Moreover, market-moving events have been scarce apart from the push for the spot and futures-based Ethereum exchange-traded funds (ETFs). There have been reports that the Securities and Exchange Commission (SEC) is going to greenlight a futures-based ETH ETF in October.
Futures-based Bitcoin ETF products have been in existence for more than two years, allowing investors, especially institutional to seek exposure to crypto without having to buy and store BTC.
Following the approval of the first BTC ETF product, Bitcoin price rallied by over 60%. Hence, the positive outlook investors have for Ethereum price in October.
Ethereum Price Set To Reclaim $1,600 Support
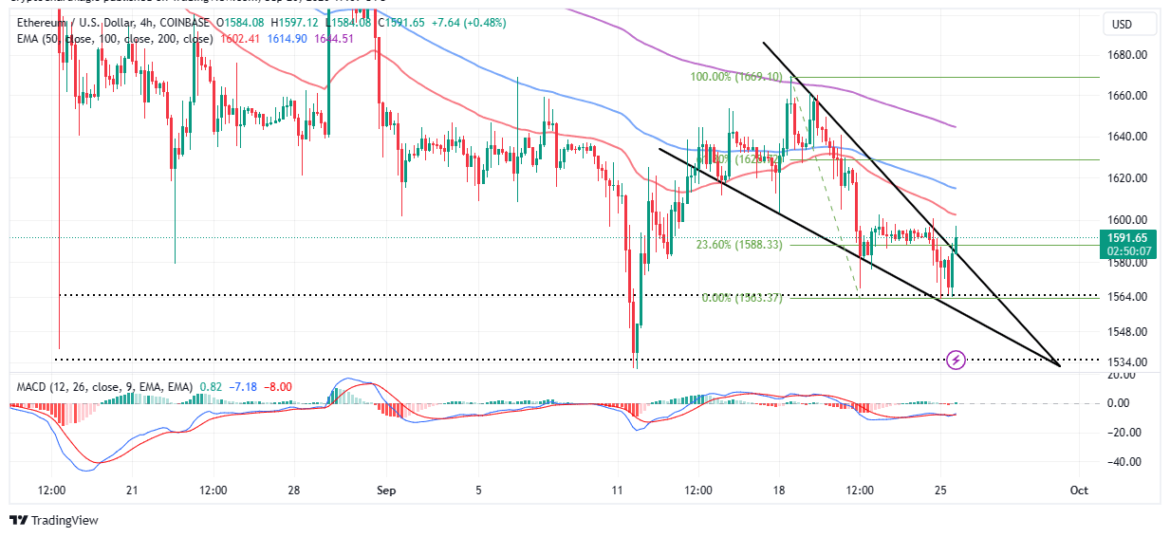
Ethereum swept through fresh liquidity at $1,564, paving the way for two bullish successive candles on the four-hour chart. Due to this rebound, a breakout from a short-term falling wedge pattern has been validated.
The falling wedge, formed by connecting a series of lower lows and lower highs using two trendlines is a reversal pattern that shows the downtrend has come to an end and bulls are ready to take the reins.

A wedge pattern alone does not affect the trend until Ethereum price makes it above the resistance trendline. Traders would notice a spike in volume following the breakout as the signal to place their buy orders marginally above the trendline. It is often recommended to wait for a retest of the resistance trendline to confirm the breakout.
A buy signal from the Moving Average Convergence Divergence (MACD) could boost the bulls’ growing presence in the market as buyers increase their exposure to Ethereum. Such a call to buy ETH manifests with the blue MACD line crossing above the red signal line while the momentum indicator generally slopes upward toward the mean line (0.00) and into the positive region.
Based on the Fibonacci levels, ETH price will likely rebound 61.8% from support at $1,564 to $1,628, especially if bulls retake the $1,600 resistance.
Ethereum Open Interest Soars To $5.31B
Interest in Ethereum derivatives has been growing over the past few days, with Coinglass showing the open interest up 4.1% to $5 billion. In total, volume is up 332% to $10.35 billion. Liquidations over the last 24 hours rekt $5.55 million in short positions and $3.88 million in long positions.

If interest keeps growing ahead of the anticipated approval of the futures ETF in October, Ethereum price could launch the run-up to $1,800 and eventually bring down the psychological resistance at $2,000.
Related Articles
The presented content may include the personal opinion of the author and is subject to market condition. Do your market research before investing in cryptocurrencies. The author or the publication does not hold any responsibility for your personal financial loss.


✓ Share: