Published 8 seconds ago
Cardano Price Analysis: After witnessing a heavy sell-off in the second week of June, the ADA price went sideways above $0.24 support. Over the past six days, the coin chart showed several short-bodied and high-wick candles indicating uncertainty among market participants. Amid this consolidation, the traders can mark the nearest significant levels to check to determine the future prospect of this coin.
Also Read: Cardano Price Analysis: $ADA Price to Face High Volatility Before an Explosive Move; Buy Now?
Cardano Price Daily Chart
- The ADA price may face intense demand pressure at $0.24 support
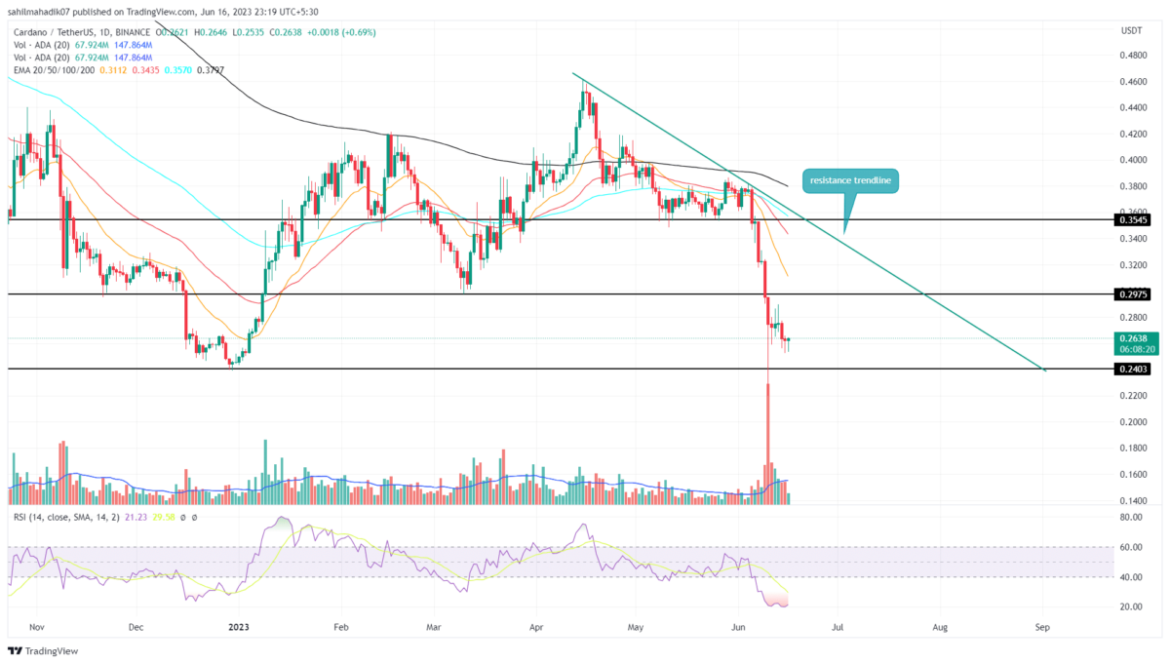
- The sellers may prolong the ongoing correction trend in ADA until the downsloping trendline is intact.
- The intraday trading volume in the ADA coin is $192.5 Million, indicating a 37.35% loss
 Source- Tradingview
On June 10th, the Cardano coin showcased a long-tail rejection candle at $0.24 support. Following a massive sell-off, this buying was mainly due to accumulation for investors entering at discounted prices.
Thus ongoing bearish trends and accumulation from buyers cause the current sideways movement in ADA price. If the overhead supply pressure persists, the prices could plunge to another 8% to revisit the bottom support of $0.24.
This retest could give additional confirmation for a new relief rally in Cardano.
However, in the daily chart, the upside could be limited to a downsloping trendline which is carrying a correction phase over the past two months.
Will Cardano Price Surpass $0.35 Mark?
The current sideways movement in ADA price is likely to stabilize the build-up buying pressure after the excessive sell-off in the coin’s market value. This battle between the buyers and sellers could trigger a range formation between $0.3 and $0.24. However, for buyers to reclaim the $0.35 mark they need a breakout range resistance of $0.3 and an overhead trendline to kickstart a new recovery that could surpass $0.3
- Relative Strength Index: The daily RSI slope at the oversold region reflects an unstable price behavior due to excessive selling and therefore it needs to be balanced by an influx of buying pressure in order to establish a sustainable trend.
- Exponential Moving Average: The 20-day EMA could be a dynamic resistance in a high momentum downtrend.
The presented content may include the personal opinion of the author and is subject to market condition. Do your market research before investing in cryptocurrencies. The author or the publication does not hold any responsibility for your personal financial loss.


