Published 21 mins ago
Amid the recent recovery in the crypto market, the Chainlink price showed a sharp reversal from the $5 psychological support. The recovery rally gradually shaped into a bullish reversal pattern called an inverted head and shoulder pattern. A recent breakout from this pattern’s resistance trendline signals a potential upswing in the LINK price. How far can this recovery rally go?
Also Read: Why Chainlink (LINK) Price Is Rising Today?
Chainlink Price Daily Chart
- The inverted H&S pattern is often spotted at the end of a downtrend and can trigger a significant up rally upon completion.
- Resistance trendline breakout set LINK price for a 22% upswing
- The intraday trading volume in the LINK coin is $571.5 Million, indicating a 168% gain.
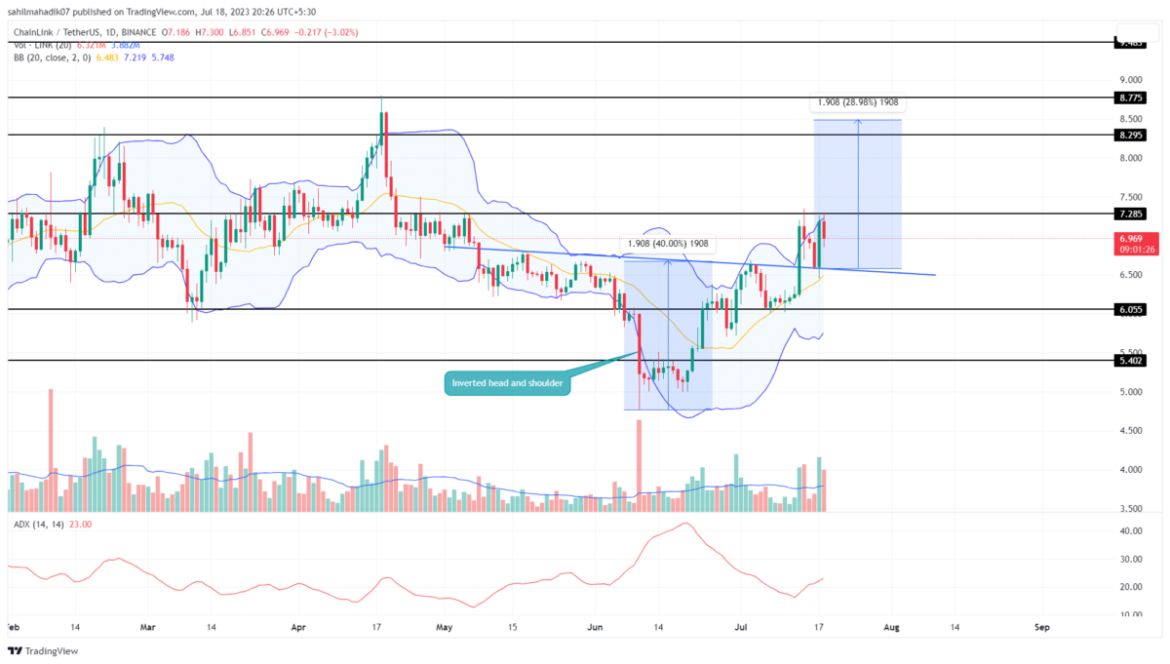
 Source- Tradingview
On July 13th, the Chainlink price gave a high momentum breakout from the neckline resistance of the inverted H&S pattern. A minor retest to the breached trendline showcased the buyers are defending the new support and can use it to rise higher.
The LINK price surged 5.3% higher from the breakout point and currently trades at the $6.96 mark. However, under the influence of this bullish reversal pattern, the asset price is poised for a rally of the distance between the pattern’s head and neckline level.
Therefore, if the buying momentum persists, the Chainlink price could rise 22% higher to meet the $8.5 barrier.
Can LINK Price Sustain Current Recovery?
With a 2.6% intraday loss, the LINK price turned down from the $7.285 resistance indicating its second reversal within a week. This rejection reflects some weakness in bullish momentum and strong supply pressure at the aforementioned barrier. If the market sentiment shows no improvement, the coin price could retest the breached trendline at $6.55. A less likely yet possible breakdown from this trendline will offset the bullish thesis.
- Bollinger Band: The LINK price challenges the upper band of the Bollinger band indicator projecting the buying activity is still aggressive
- Average Directional Index: An uptick in the daily ADX slope near 22% indicates the buyers have sufficient strength to carry further recovery.
The presented content may include the personal opinion of the author and is subject to market condition. Do your market research before investing in cryptocurrencies. The author or the publication does not hold any responsibility for your personal financial loss.


