Dogecoin price is gaining pace on Friday bolstered by a renewed bullish outlook across the market, thanks to the discussions around the approval of the first Ethereum futures ETFs set to start trading as soon as October 3. The largest meme coin has responded extremely well to the news alongside other major cryptos.
Bitcoin is up 2% to $26,970, Ethereum has increased by 3% to $1,650 while XRP is up 2.4% on Friday to $0.509. The impact of the bullish wave has been positively influential with the total market cap rising by 2.1% to $1.1 trillion.
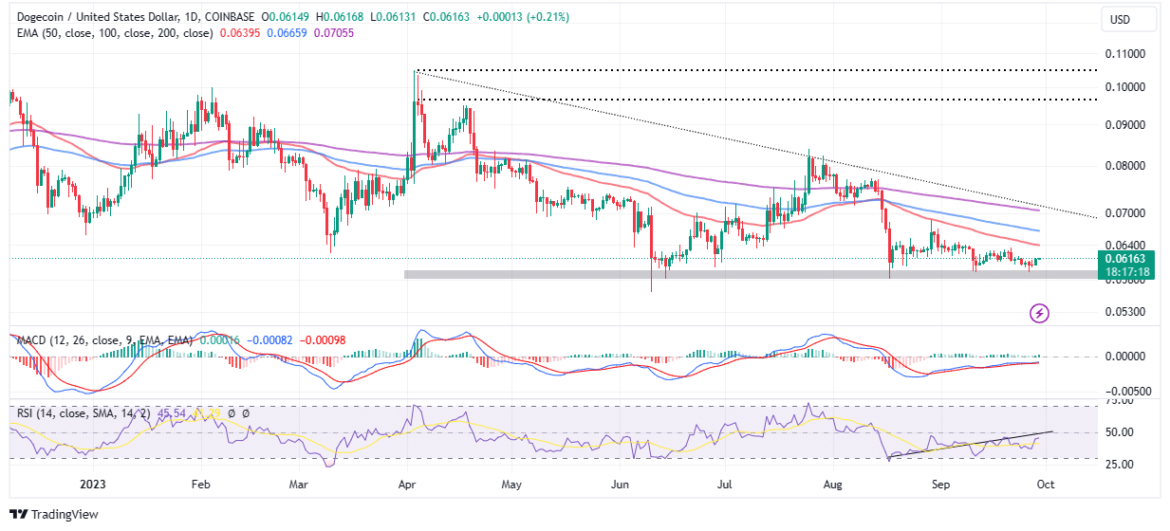
Dogecoin Price Prediction: Can Dogecoin Price Rally?
Dogecoin price has steadied the uptrend following support at $0.06 to trade above key levels starting with the 50-day Exponential Moving Average (EMA) (red) at $0.0612 and a month-long descending trendline.
Indicators such as the Moving Average Convergence Divergence (MACD) and the Direction Movement Index (DMI) are already aligning in support of the growing uptrend. Traders can seek more exposure to DOGE longs assured that the blue MACD line is above the red signal line. The momentum indicator holds above the mean line (0.00) and is moving higher, validating the uptrend.

As for the DMI, a bullish signal appeared when the blue +DI line crossed above the -DI line. This indicator measures the strength and direction of the trend. If the movement of the +DI and -DI change, Dogecoin price would be on the verge of a correction.
Despite the bullish signals traders should consider waiting until the resistance at the 100-day EMA (blue) is defeated before activating their long positions. Such a move will trigger a spike in trading volume thus calling more investors to seek exposure to DOGE.
There is the possibility of sellers exploiting potential resistance areas such as the descending trendline between $0.062 and $0.063. Once out of the way, the focus will shift to the subsequent hurdle at $0.063 with the 200-day EMA (purple) holding slightly below it at $0.0628. A natural break above this price point could launch Dogecoin price into the next bull run.
The MACD sustains the bullish outlook on the daily chart while the Relative Strength Index (RSI) reinforces the uptrend.

However, caution is advised since DOGE holds below all three major moving averages on the daily chart. This puts bulls at a disadvantage meaning sellers have many potential opportunities to exploit Dogecoin and dampen the uptrend.
The first and most significant bullish step based on the daily chart would be to break out of the narrow range channel with the upper limit at $0.064 – reinforced by the 50-day EMA. Another bull run signal would come with DOGE boosting above the multi-month descending trendline around $0.07 and encompassing the 200-day EMA. From here the path to $0.1 would be relatively clear.
Related Articles
The presented content may include the personal opinion of the author and is subject to market condition. Do your market research before investing in cryptocurrencies. The author or the publication does not hold any responsibility for your personal financial loss.


✓ Share: