Published 41 mins ago
Binance Coin Price Analysis: Binance the world’s largest crypto exchange facing legal action against the U.S. The Securities and Exchange Commission (SEC) has put its native token BNB under intense selling pressure. Within the week, the altcoin’s market value dropped 17.5% and plunged to a low of $253.3. However, the aforementioned support aligned with the long-coming support trendline of the triangle pattern indicates the BNB price stands at a high accumulation zone.
Also Read: Binance US To Remove Hundreds Of Trading Pairs; Halts OTC Trading
Binance Coin Price Daily Chart
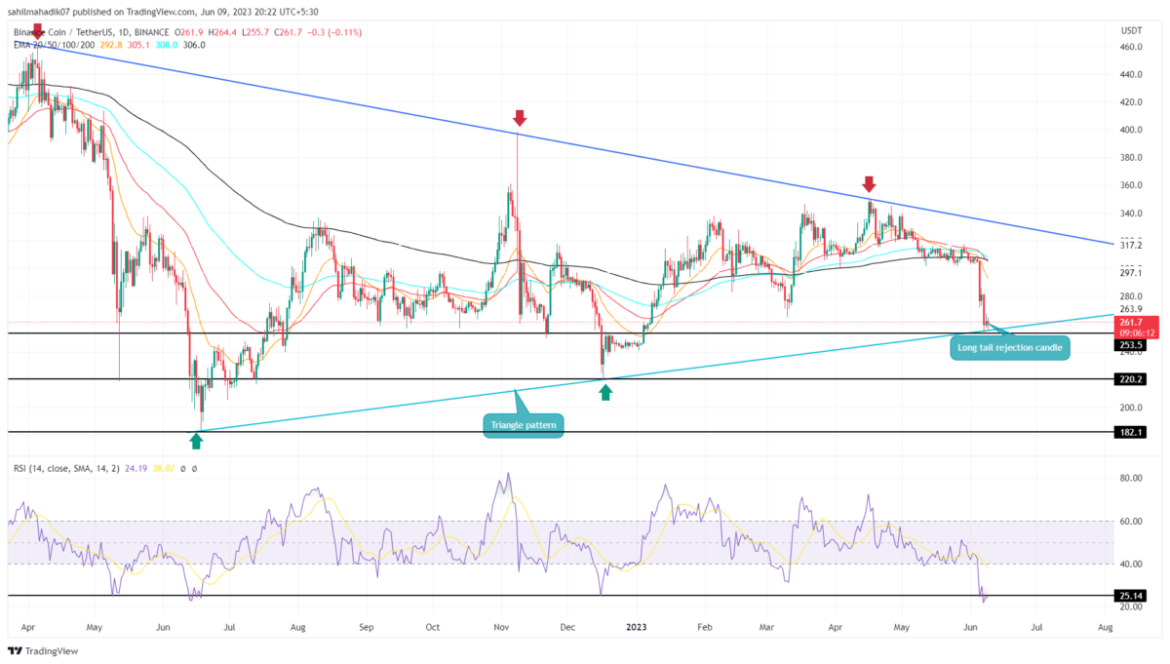
- A bullish reversal from the triangle pattern’s support trendline offers a bullish swing opportunity to traders.
- A daily RSI slope plunge to the Dec 2022 low after which the BNB price witnessed a massive rally of nearly a year
- The intraday trading volume in the BNB coin is $389.5 Million, indicating an 11.2% loss
 Source- Tradingview
The Binance coin price shows the formation of a symmetrical triangle pattern in the daily time frame chart. This pattern consists of two converging trendlines that create a shrinking range and eventually lead to massive upon on the breakout side.
By press time, the BNB price traded at the $262.6 mark and continued to hover above the long-coming support trendline. With an intraday gain of 0.3%, the daily chart shows a long-tail rejection at this multiple-month support indicating the buyers are accumulating at this support.
The rise in bullish momentum could lead to a bullish reversal and surge the coin price back to a higher level. The potential rally could push the prices back to the overhead trendline near the $315 mark, registering a 20% growth potential.
A breakdown below the mentioned trendline will invalidate the bullish thesis.
Will the BNB price go back to $300?
In theory, a bullish reversal from the triangle pattern’s support trendline triggers a new bull cycle. This reversal could offer a short-term trade opportunity and lead the price back to $300 to meet the above trendline. Anyhow, the traders can expect a sustained recovery rally only if the price breach the overhead trendline
- Relative Strength Index: The daily RSI slope dives to the oversold region indicate the seller activity went overboard and more buyers could take advantage of a discounted price
- Exponential Moving Average: A bearish crossover between the 50-and-200-day EMA may increase the selling pressure in the market, and could trigger a minor consolidation above the trendline
The presented content may include the personal opinion of the author and is subject to market condition. Do your market research before investing in cryptocurrencies. The author or the publication does not hold any responsibility for your personal financial loss.


