Published 14 mins ago
The Ethereum price prolongs its correction trend, as the largest cryptocurrency Bitcoin resulted in its month-long correction on a bearish note. Within a fortnight, the Ethereum price has plunged from a high of $2028 to a current price of $1862, registering a 7.8% loss. Amid this downfall, the coin price also breached the support trendline of the megaphone pattern suggesting further downfall in ETH.
Also Read: Ethereum Price Charts Signals 18% Upside; Liquid Staking Hits ATH in 2023
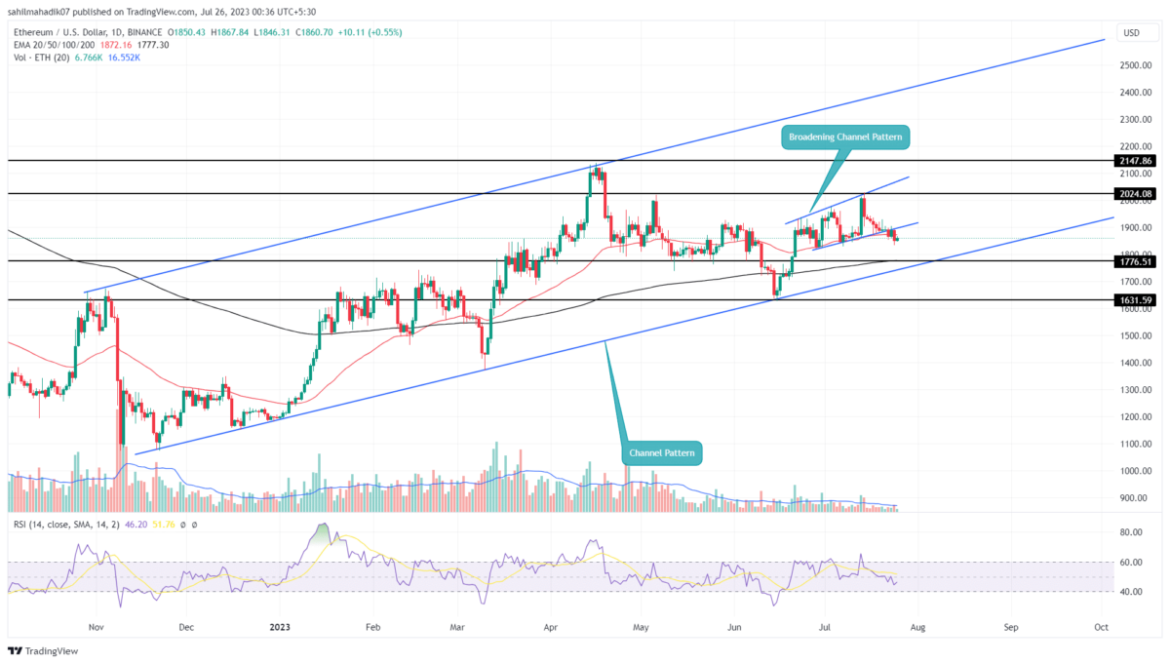
Ethereum Price Daily Chart
- The strong support of the rising trendline could offer buyers an opportunity to rebound.
- The Ethereum Fear and Greed index at 46% reflect a neutral sentiment among traders
- The intraday trading volume in Ether is $4.13 Billion, indicating a 36% loss.
 Source- Tradingview
For over a month, the Ethereum price showcased a silent recovery within the divergence trendline of the Megaphone pattern. This pattern formation is a sign of uncertainty and increasing volatility among market participants.
With the recent downturn in the crypto market, the ETH price breached the support trendline of the aforementioned pattern on July 22nd. This crackdown flipped significant support into a potential resistance that sellers can use to pressurize the coin price lower.
If the coin sellers manage to sustain this breakdown, the altcoin price could fall 4-5% to reset the ascending trendline at $1775. This trendline currently maintains the overall uptrend in the second-largest cryptocurrency and offers a dip opportunity to interested buyers.
Can ETH Price Regain Bullish Momentum?
Taking a look at the bigger picture, the rising channel pattern is leading to an uptrend in Ethereum price. In the last eight months, the price retest to the lower trendline of this pattern has bolstered buyers with bullish momentum to create a new high of 2023. Thus, the crypto holders must keep a watch on the support trendline of signs of a reversal to catch the next recovery cycle.
The presented content may include the personal opinion of the author and is subject to market condition. Do your market research before investing in cryptocurrencies. The author or the publication does not hold any responsibility for your personal financial loss.


