Published 13 seconds ago
Ethereum Price Analysis: Today on June 10th, the crypto market witnessed a massive liquidation amid the US SEC lawsuit against big crypto exchanges Binance(BNB) and Coinbase(COIN). As a result, the market leaders Bitcoin and Ethereum tumbled 2.5% and 6.5% on intraday levels respectively. Amid this downfall, the ETH price lost crucial monthly support of $1775-$1765 indicating the coin holders could experience an extended correction.
Also Read: Ethereum Co-Founder Names Three Key Transitions to Watch as Network Grows
Ethereum Price Daily Chart
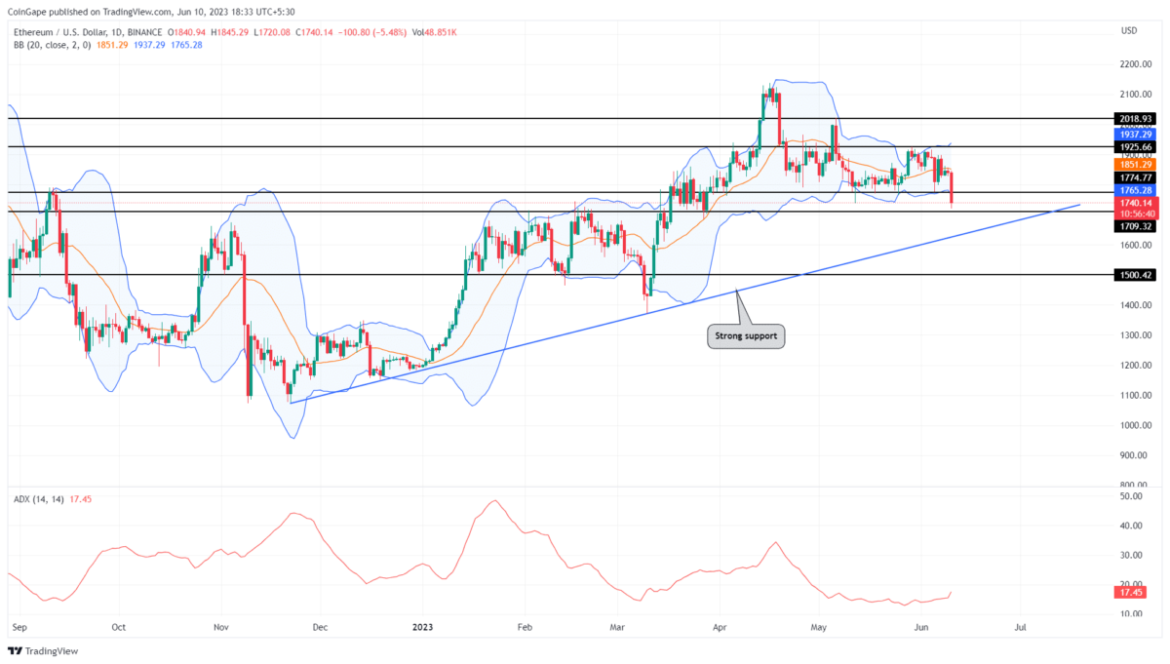
- A bearish breakdown below the $1765 support sets the ETH price on a 5.5% loss
- The long-term trend for Ethereum stays bullish as long as the support trendline is intact;
- The intraday trading volume in Ether is $4.6 Billion, indicating a 0.27% loss.
 Source- Tradingview
Today, the Ethereum price showcased a high momentum breakdown from the $1775-$1765 support level. Losing this last swing low support hints the ETH price may prolong the ongoing correction phase.
If the daily candle closes below the $1765 support the selling pressure will accelerate and offer trades the opportunity to short sell. With sustained selling the coin price will tumble 5.5% to hit the long-coming support trendline.
Previously, a retest to this support trendline triggered a significant recovery in the ETH price, validating this level as a crucial accumulation zone. Therefore, potential traders must mark this dynamic support if looking for a dip opportunity.
Will Ethereum Price Reach $1700?
The intense sell-off today backed by high volume indicates the sellers have a strong conviction to take the Ethereum price lower. With the breakdown of $1775-$1765 support, the coin price will more likely plunge to the next significant support of $1700, followed by the combined support of $1650 and ascending trendline.
- Average Directional Index: The uptick in the daily ADX slope assures sufficient strength in sellers to carry further downfall.
- Bollinger Band: A downtick in the lower band of the BB indicator accentuates high momentum selling in the market.
The presented content may include the personal opinion of the author and is subject to market condition. Do your market research before investing in cryptocurrencies. The author or the publication does not hold any responsibility for your personal financial loss.


