Published 5 seconds ago
Bitcoin Price Analysis: Last week’s consolidation in the largest cryptocurrency Bitcoin created an uncertain sentiment in the crypto market. However, this sideways action came after the significant drop witnessed in the latter part of July, indicating the sellers tried to recuperate the exhausted bullish momentum. A recent breakdown of the range pattern formed amid consolidation suggests the BTC price is poised for a prolonged downfall.
Also Read: Bitcoin Takes a Backseat, Ethereum and XRP Dominate Crypto Market: Report
Bitcoin Price Daily Chart
- Bitcoin Fear and Greed index at 53% reflect neutral sentiment among market participants
- A potential bearish crossover between the 20-and-50-day EMA could accelerate supply pressure in the market.
- The intraday trading volume in Bitcoin is $13.8 Billion, indicating a 24% gain.
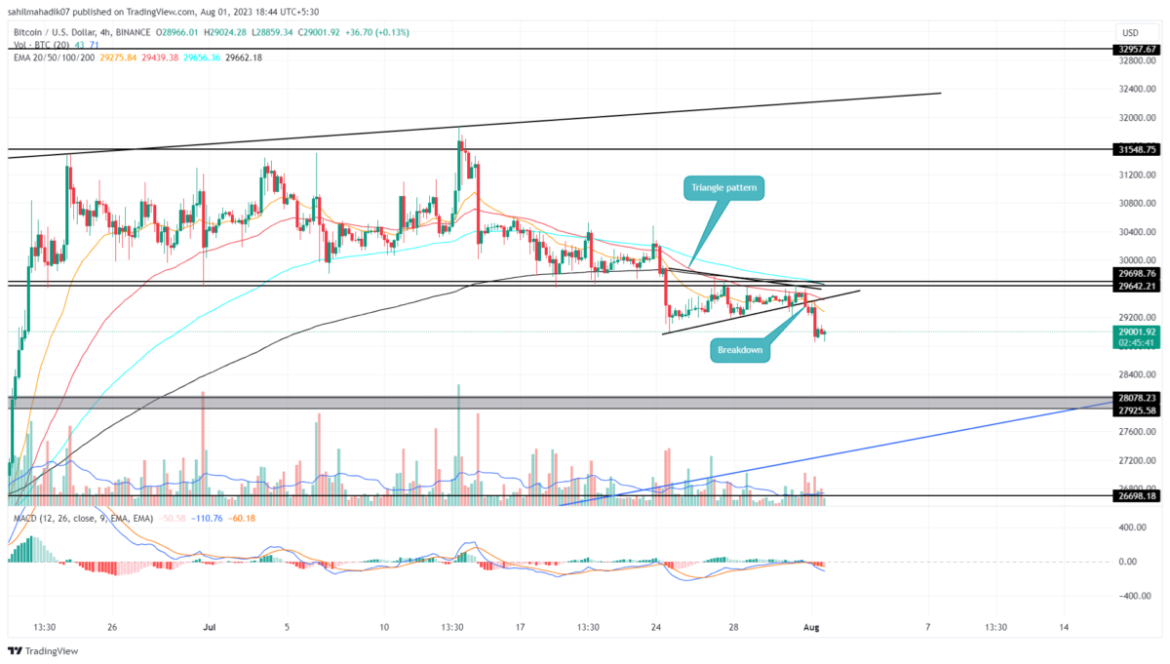
 Source- Tradingview
The 4-hour time frame chart showed the recent consolidation as the formation of a symmetrical triangle pattern. This chart pattern is commonly observed in an established trend, offering a short break before the prices continue with prior movement.
On July 31st, the Bitcoin price gave a bearish breakdown below the pattern’s support trendline, providing sellers additional resistance to pressurize the buyers. From the breakdown point of $29387, the coin price plunged 1.68% to reach the current price of $28936.
Furthermore, the chart patterns are excellent in offering price targets, as in the case of the triangle pattern, the longest swing between the converging trend lines is the potential target post-breakout.
Thus, with sustained selling the Bitcoin price could plunge another 3.7% to retest $28000-$27925.
Will $28000 Support Hold?
The falling Bitcoin price may soon reach the $28000 level aligned with a long-coming support trendline. However, the decreasing volume in this downfall indicates a lack of interest from traders to enter bearish trade and a high possibility of reversal. If the coin price manages to sustain this support, the crypto investor can accumulate for the next recovery cycle.
The presented content may include the personal opinion of the author and is subject to market condition. Do your market research before investing in cryptocurrencies. The author or the publication does not hold any responsibility for your personal financial loss.


