A sudden surge in BTC price triggered recovery sentiment across the crypto market. Time to buy?
Published 13 seconds ago
On 29th August, the BTC price witnessed a significant inflow and registered a 6% intraday gain. The buying pressure is likely associated with a federal court verdict in favor of Grayscale over the U.S. Securities and Exchange Commission (SEC) for Bitcoin ETF. The BTC price jumped from $26100 to $27700, triggering a fresh recovery sentiment in altcoins. However, is this price enough to restore bullish momentum?
Also Read: Grayscale Victory: Expert Reveals What Comes Next for Bitcoin ETF
Bitcoin Daily Chart: Key Points
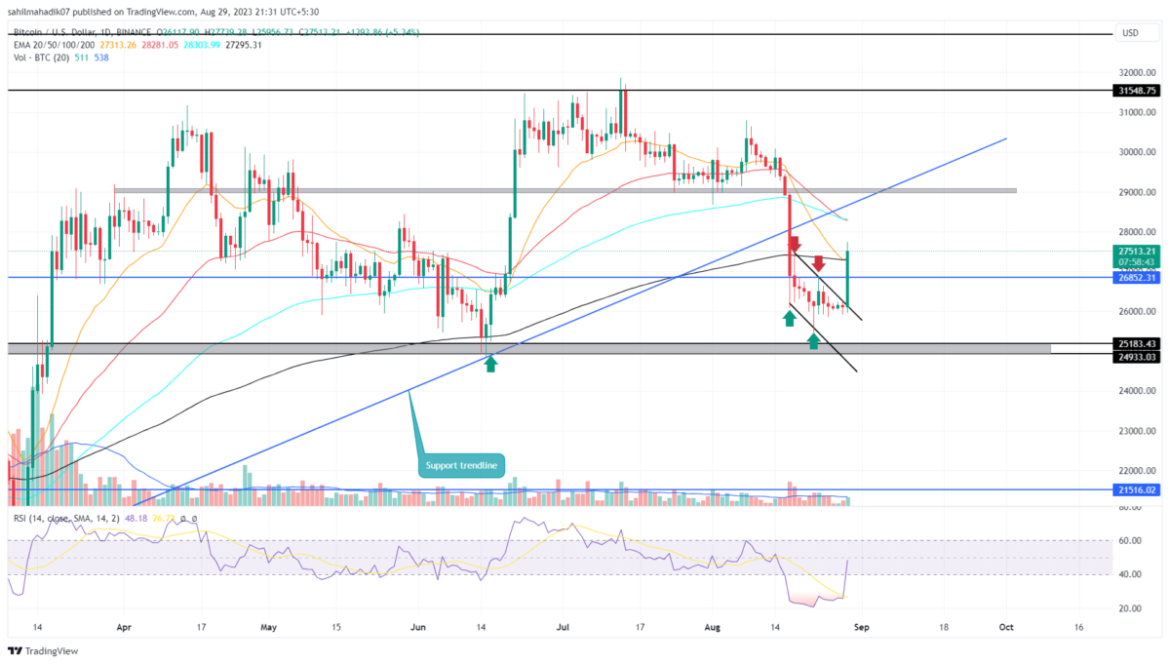
- A bullish breakout from the chart pattern of $27000 will set a 5.5% price jump
- The holders may face intense supply pressure at the $29000 mark
- The intraday trading volume in Bitcoin is $24.9 Billion, indicating a 148% gain.
 Source- Tradingview
For the past two weeks, the Bitcoin price witnessed high volatility gradually falling within the range of a downsloping channel pattern. The 4-hour time frame chart reflects the pattern structure and massive breakout from its upper trendline with today’s price jump.
In theory, this upside breakout is an early sign of trend reversal, which can bolster bulls to prolong a recovery rally. If the daily candle closes above the $27000 psychological level, the buyers will obtain a suitable footing to lead the price 5.5% higher to hit $29000.
The Bitcoin holders are likely to witness significant supply pressure at this barrier due to the confluence of the August 17th high and an ascending trendline. If the coin price shows sustainability below these overhead resistances, the sellers may continue to the downward trend.
Will the BTC Price Kickstart a Fresh Recovery Rally?
The August 17th daily candle is a significant weapon for sellers as it showcased high volume and gave a breakdown below the nine-month-long chart pattern. Thus, several short-sellers might keep their stop loss above this candle’s high. If the recent price bolsters a breakout above this barrier, the buyers will get a better confirmation to lead a recovery rally above $30000.
The presented content may include the personal opinion of the author and is subject to market condition. Do your market research before investing in cryptocurrencies. The author or the publication does not hold any responsibility for your personal financial loss.


