Increased supply pressure led Doge price below crucial supports; will the correction trend hit $0.06?
Published 4 seconds ago
Amid the recent altcoin market selloff, the popular memecoin DOGE wasn’t spared as it succumbed to significant outflows on September 10th. Notably, this drop sent the coin price below the critical support trendline which carried a relief rally for over three weeks. Such a breakdown typically signals a continuation of the downtrend, suggesting DOGE price is poised for further fall.
Also Read: US CPI Inflation Jumps 3.7%, How’s The Crypto Market Faring?
Key Support Breakdown Point to Prolong Correction
- A support breakdown has been set to extend the downward course by 8%
- The DOGE price is likely to witness strong demand pressure at $0.065
- The intraday trading volume in the DOGE is $198 Million, indicating a 7% loss
 Source: Tradingview
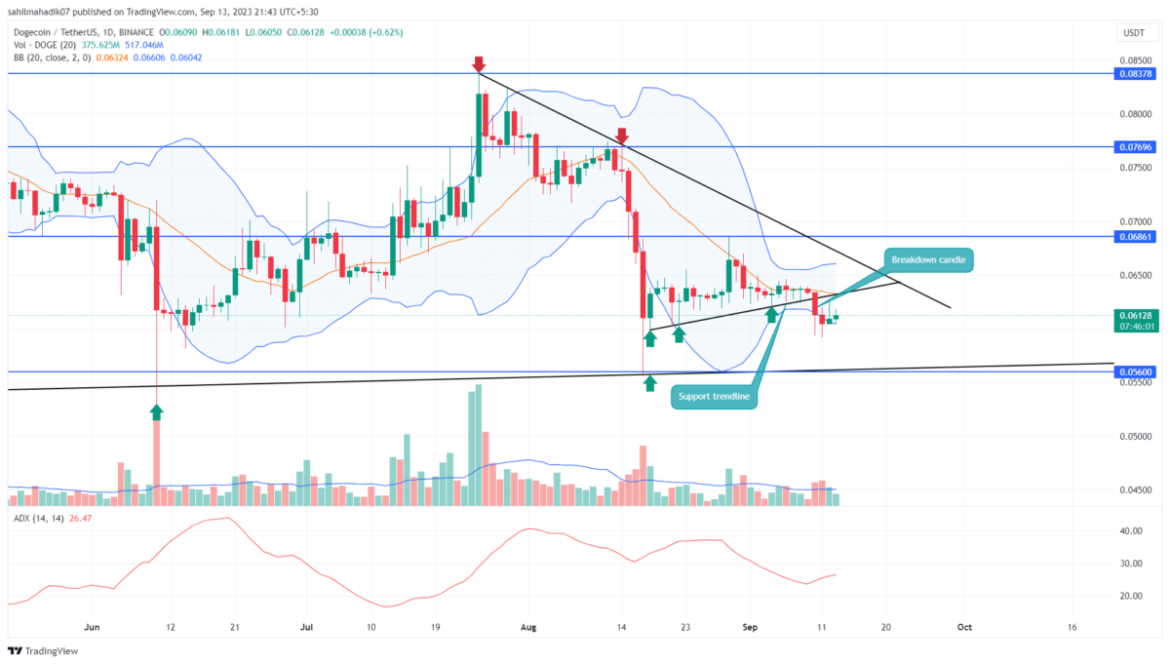
In the preceding weeks, the Dogecoin price moved largely sideways but witnessed strong support from an ascending trendline. This memecoin obtained a surge in buying pressure every time it dipped to this support, carrying a relief rally in the daily chart. This setup often emerges in an established downtrend and recuperates the selling pressure for further downfall.
Come September 11th, the DOGE price decisively broke below the support trendline, diving to a $0.0593 low. However, the bulls were quick to react, pushing the price up in a retest of the now-resistance trendline. At the time of writing, the Dog-themed coin stands at $0.061, and the price rejection wick at the top reflects the overhead supply pressure.
If this retest phase shows price sustainability below the trendline, this coin price might see an additional decline of roughly 8%, targeting the $0.056 zone.
Can DOGE Price Regain Trend Control?
Despite its severity, the bearish candle on September 10th, lacked substantial follow-through in subsequent days, hinting at potential bearish exhaustion. Should the buyers regain control and push DOGE above $0.0636, it would likely invalidate the recent breakdown, potentially marking it as a bear trap. Such a development could reignite buying interest, shifting the momentum back in favor of the bulls.
- Bollinger Band: A downtick in the lower band of the Bollinger Band indicator shows the selling momentum is active.
- Average Directional Index: The ADX slope at 26% indicates the sellers have enough fuel to prolong the ongoing downtrend.
The presented content may include the personal opinion of the author and is subject to market condition. Do your market research before investing in cryptocurrencies. The author or the publication does not hold any responsibility for your personal financial loss.


