Published 7 seconds ago
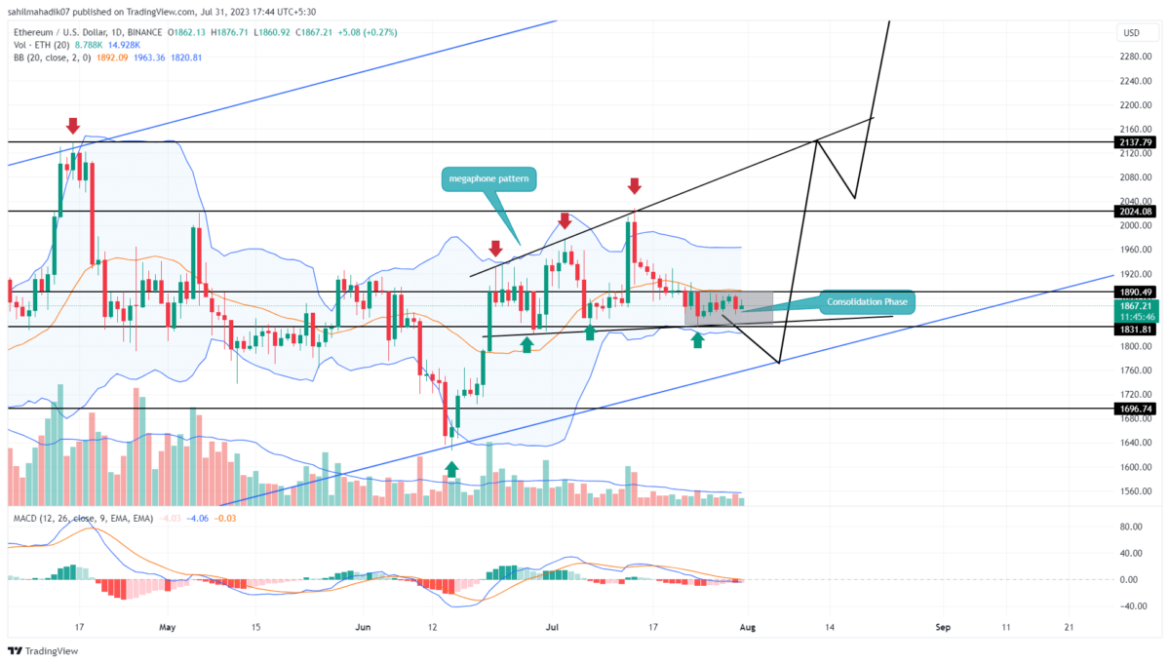
Ethereum Price Analysis: Amid the increasing FUD in the crypto market, the Ethereum price correction phase stalled at the support of the megaphone pattern near the $1830 mark. This support was expected to bolster buyers for a bullish reversal, but the price trend turned sideways. The consolidation reflects a weakness in bullish momentum as buyers fail to push the altcoin higher despite obtaining strong support. Will ETH price rebound to $2000 or the correction phase may prolong below $1800?
Also Read: Ethereum Price Charts Signal Buy The Dip Opportunity Ahead
Ethereum Price Daily Chart
- The price range between $1890 and $1830 creates a no-trading zone.
- A bullish breakout from the $1890 resistance would trigger a new recovery cycle within the megaphone pattern
- The intraday trading volume in Ether is $4.8 Billion, indicating a 48% gain.
 Source- Tradingview
On July 24th, the Ethereum price witnessed a 2% intraday fall and reached the bottom trendline of the megaphone pattern at $1830. Since then the price trend turned sideways and remained within the range of the aforementioned red candle.
The $1890 resistance and $1830 support are the crucial levels that can influence the near future trend of ETH coins. Currently, the second-largest cryptocurrency Ethereum trades at $1868, with a bullish candle of 0.3% gain.
If the overhead supply continues to pressure the market participants, a breakdown below the pattern support trendline and $1830, will increase the selling momentum. The breakdown may. pull the price to $1800 support, registering a potential 4% drop.
The anticipated pullback to $1800 can allow interested traders to accumulate at the support trendline carrying the current uptrend.
Here’s How ETH Price May Regain $2000 Mark
For Ethereum price to regain its bullish recovery, the buyers need to break the overhead resistance of $1890. This breakout will indicate the microphone pattern is still intact and the bull cycle within this structure could lead Ethereum price near $2200.
- Bollinger band: The lower support of Bollinger band moving sideways could offer strong support for crypto buyers.
- Moving average convergence divergence: the MACD(blue) and signal(Orange) lines going flat at the median level indicate uncertainty traders.
The presented content may include the personal opinion of the author and is subject to market condition. Do your market research before investing in cryptocurrencies. The author or the publication does not hold any responsibility for your personal financial loss.


