Published 12 seconds ago
Pepepcoin Price Analysis: In the latter half of June, the frog-themed cryptocurrency PEPE witnessed a significant inflow and surged the prices to $0.00000179 monthly high. This price rally was sharp and backed by increasing volume indicating high momentum buying from market participants. However, the Pepecoin price currently witnesses a post-rally correction, which could refuel the bullish momentum for further rally.
Also Read: Pepecoin Price Coiling for Potential Leap; Is $0.000002 the Next Target?
Pepecoin Price Daily Chart
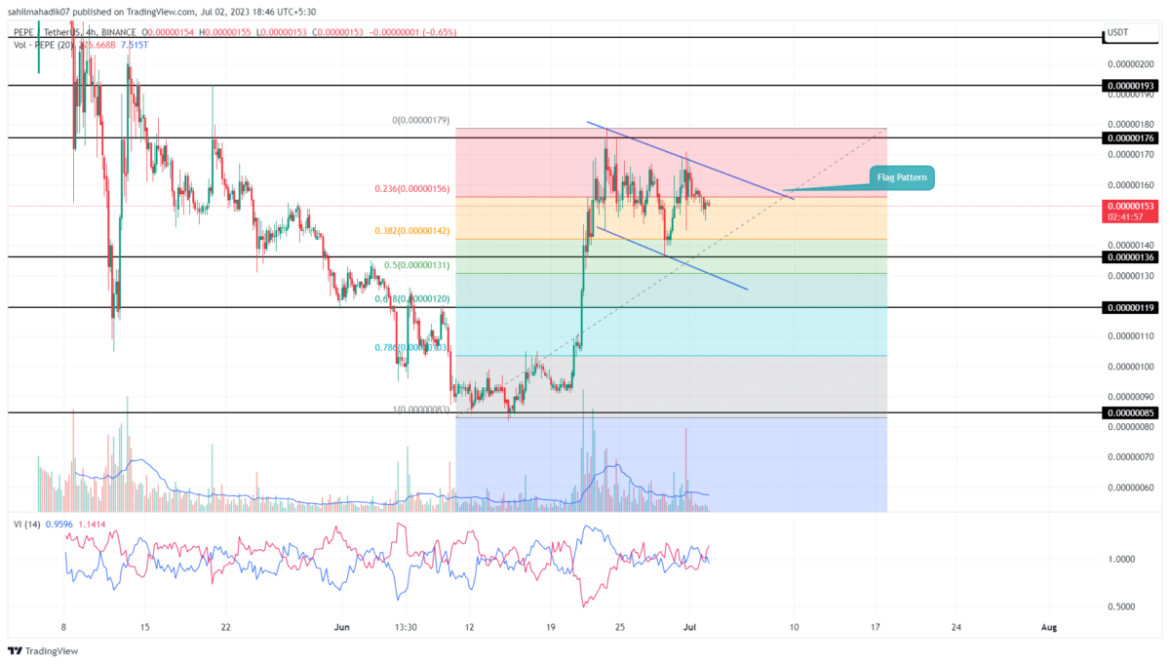
- The Pepecoin price shows the formation of a flag pattern in the 4-hour time frame chart.
- A breakout above the overhead trendline will signal an uptrend continuation.
- The 24-hour trading volume in the Pepecoin coin is $85.1 Million, indicating a 71 % loss.
 Source-Tradingview
For over a week, the Pepecoin price has shown alternative green and red candles in the daily chart, indicating uncertainty among traders. However, this pullback is confined between two downsloping trend lines suggesting the formation of a flag pattern.
This bullish continuation pattern indicates the correct correction is temporary and the buyers could resume the prevailing uptrend upon the breakout of the resistance trendline. By the press time, the PEPE price trades at $0.00000153, and with a 1.92% intraday loss, it continues to plunge lower in the retracement phase.
The potential buyers could wait for a resistance trendline breakout, offering a strong launchpad to take prices to the $0.00000193 high, followed by $0.0000021.
Will Pepecoin Coin Sustain Above 0.0000014 Mark?
The Flag patterns bolster the continuation of an established uptrend as they offer in-between pullbacks to recuperate bullish momentum and provide better entry opportunities. However, until the pattern’s trendlines are intact, the PEPE price could continue a longer correction rally and may plunge below the $0.00000140 mark. Thus, support aligned with 38.2% FIB level stands a significant support that could assist buyers to break the overhead trendline.
- Vortex Indicator: A VI+ slope(blue) above the VI- line(orange) indicates a bullish alignment and positive sentiment for further rally.
- Fibonacci retracement level: The correction phase sustaining above the 50% FIB level indicates the overall market trend remains bullish.
The presented content may include the personal opinion of the author and is subject to market condition. Do your market research before investing in cryptocurrencies. The author or the publication does not hold any responsibility for your personal financial loss.


