Bitcoin Price Prediction: The distribution phase at key resistance hints the BTC price is poised for a bearish correction.
Published 12 seconds ago
Bitcoin Price Prediction: Over the past two weeks, the Bitcoin price has struggled to maintain a sustainable bullish momentum as the traders witness high supply pressure from the $36,000 mark. The daily candles with short bodies and higher wicks have created an uncertain sentiment across the crypto market. Will this indecisiveness lead the BTC price into another correction?
Also Read: Is It Altcoin Season? Top Performing Altcoins This Week As Bitcoin Price Holds $35K
Current Uncertainty Threatens Potential Correction
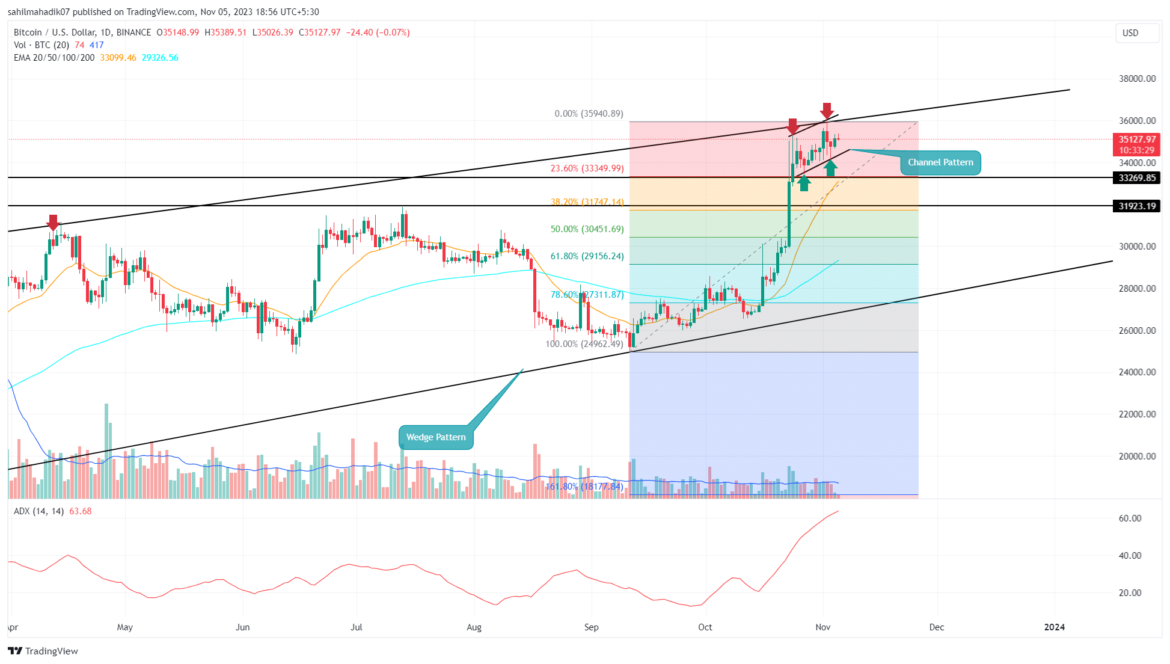
- A breakdown below the channel pattern would set a 10% drop
- The BTC price may face suitable support at $33250 followed by $32000
- The intraday trading volume in Bitcoin is $10.2 Billion, indicating a 19% loss.
 Source-Tradingview
The 4-hour chart reveals the Bitcoin price action fluctuating within a rising channel, marked by two ascending trendlines. The two dynamic resistances and support confine BTC in a narrow no-trading zone.
Such a pattern typically suggests a downside risk if the price slips below the channel’s support trendline. Compounding this is the resistance encountered at the apex of a more expansive wedge pattern, presenting an additional challenge for bullish momentum to overcome.
Should the BTC price descend through the channel’s lower boundary, we might see a decline toward the $32,000 level, which coincides with the 38.2% Fibonacci Retracement Level.
Furthermore, within the broader context of the wedge pattern, a more pronounced correction could see the coin price retracting to the $29,000 to $28,000 region.
Will BTC Price Recovery Hit $47000?
Despite these bearish indicators, it’s imperative to recognize the current market trend is a bullish trend. The present consolidation could simply be a period of accumulation, setting the stage for a resurgence of bullish energy. Should the BTC price break above the channel, it would negate the immediate bearish scenario and potentially signal an upcoming rally. A bullish breakout through the wedge’s upper resistance could pivot Bitcoin towards an ambitious target of $47,000.
- Average Directional Index: The daily ADX slope reaching a high of 63% reflects the buyers are likely exhausted and thus a pullback or consolidation is needed to revive the buying pressure.
- Exponential moving average: The 20-day EMA slope around the $32300 mark, may offer an additional support level for buyers.
The presented content may include the personal opinion of the author and is subject to market condition. Do your market research before investing in cryptocurrencies. The author or the publication does not hold any responsibility for your personal financial loss.


